> ## Documentation Index
> Fetch the complete documentation index at: https://opendata.dev/docs/llms.txt
> Use this file to discover all available pages before exploring further.
# Buffer Benchmarks
> End-to-end latency, throughput, and cost for Buffer pipelines on object storage
This page contains two benchmarks. The first measures throughput and latency of multiple OTel Collectors writing metric data to OpenData Timeseries.
The second measures the throughput and latency of a single Otel Collector writing log data to Clickhouse.
## Writing Metrics to OpenData Timeseries
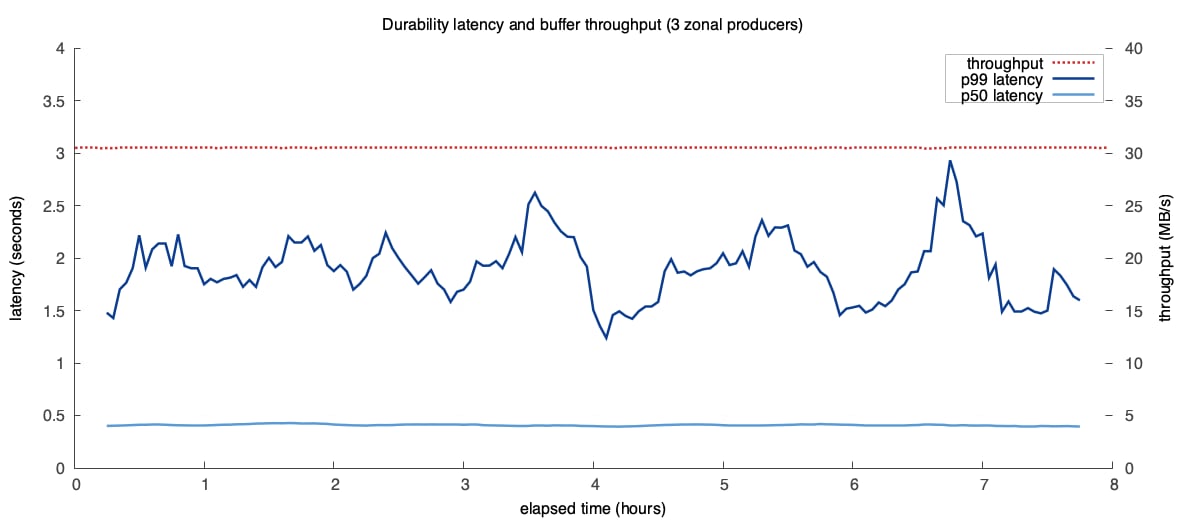
We ran an 8-hour experiment running three Buffer producers, each producing 10 MB/s (30 MB/s
total), with flush and poll intervals of 100 ms. Latency is measured from the
producer receiving a data entry to the Buffer consumer reading it.
| Metric | Result |
| ---------------------- | ------------------------------- |
| Throughput | 30 MB/s (3 producers × 10 MB/s) |
| p50 end-to-end latency | \< 0.5 s |
| p99 end-to-end latency | \~2 s |
| Flush / poll interval | 100 ms |
 End-to-end latency is tunable: raising the flush and poll intervals lowers cost
at the expense of latency, and lowering them reduces latency (to a floor of
\~50–100 ms) at increased object-storage request cost.
### Cost
S3 costs over the experiment, projected to a monthly bill:
| Request type | Number | Rate | Monthly cost |
| ------------ | ------------------------- | ---------------- | ------------- |
| PUT | 16,241,670 | \$0.005 / 1,000 | \$81.21 |
| GET | 23,908,140 | \$0.0004 / 1,000 | \$9.56 |
| Storage | 27.54 GB (max during run) | \$0.023 / GB | \$0.63 |
| **Total** | | | **\~\$91.40** |
## OTel → ClickHouse pipeline
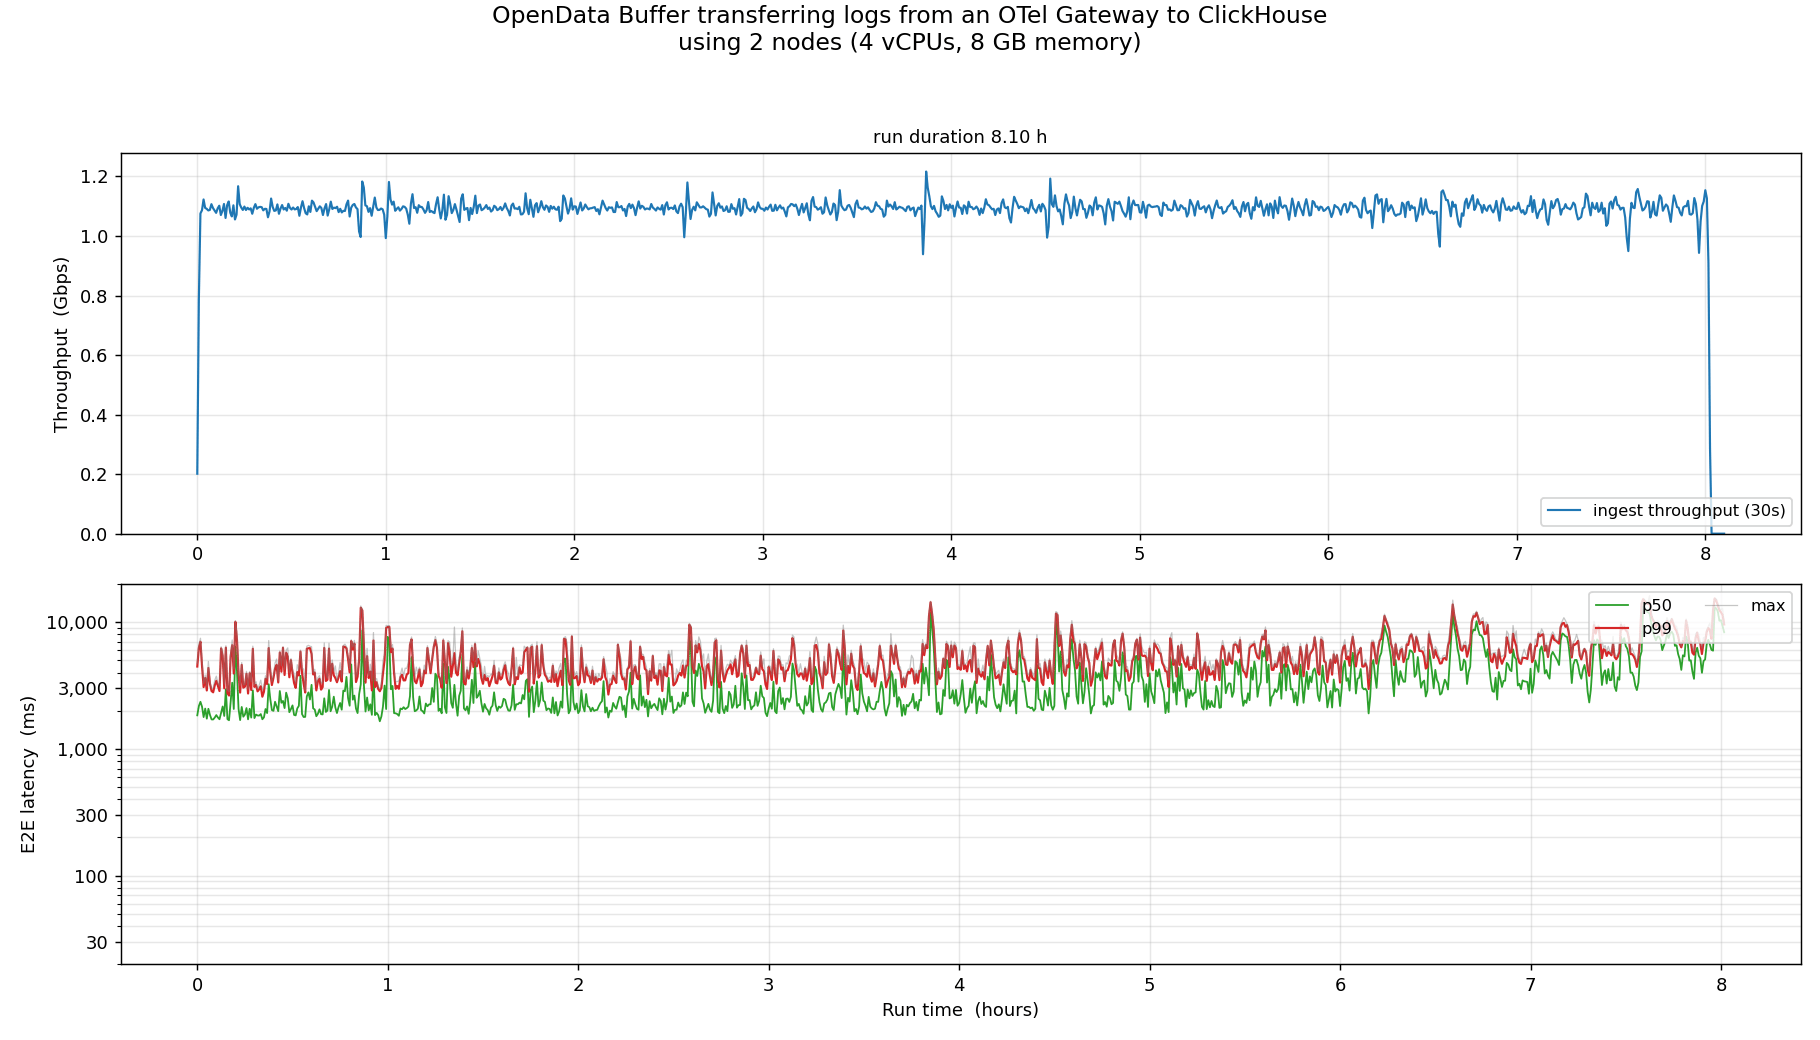
This benchmark used the pipelined producer and consumer runtimes to measure the maximum throughput of writing Logs
from an Otel Collector to Clickhouse. A single loadgen drove 175,000 log records/sec into one OTel gateway pod over
OTLP/gRPC. The gateway ran the [OpenData producer](https://github.com/opendata-oss/opendata-go#producer-architecture),
which appended OTel payloads to Buffer on S3. A separate
node running the
[ClickHouse ingestor](https://github.com/opendata-oss/opendata-contrib/tree/main/connectors/clickhouse-ingestor)
consumed the payloads and inserted them into ClickHouse.
End-to-end latency was
measured from two timestamps stamped onto each record (`_odb_gateway_received_at`
at the gateway, `_odb_clickhouse_inserted_at` at INSERT time). Latency was the difference between these two values,
computed via a query on Clickhouse. Both components, the OTel exporter and the ClickHouse ingestor, are documented on the
[Integrations](/buffer/integrations) page.
End-to-end latency is tunable: raising the flush and poll intervals lowers cost
at the expense of latency, and lowering them reduces latency (to a floor of
\~50–100 ms) at increased object-storage request cost.
### Cost
S3 costs over the experiment, projected to a monthly bill:
| Request type | Number | Rate | Monthly cost |
| ------------ | ------------------------- | ---------------- | ------------- |
| PUT | 16,241,670 | \$0.005 / 1,000 | \$81.21 |
| GET | 23,908,140 | \$0.0004 / 1,000 | \$9.56 |
| Storage | 27.54 GB (max during run) | \$0.023 / GB | \$0.63 |
| **Total** | | | **\~\$91.40** |
## OTel → ClickHouse pipeline
This benchmark used the pipelined producer and consumer runtimes to measure the maximum throughput of writing Logs
from an Otel Collector to Clickhouse. A single loadgen drove 175,000 log records/sec into one OTel gateway pod over
OTLP/gRPC. The gateway ran the [OpenData producer](https://github.com/opendata-oss/opendata-go#producer-architecture),
which appended OTel payloads to Buffer on S3. A separate
node running the
[ClickHouse ingestor](https://github.com/opendata-oss/opendata-contrib/tree/main/connectors/clickhouse-ingestor)
consumed the payloads and inserted them into ClickHouse.
End-to-end latency was
measured from two timestamps stamped onto each record (`_odb_gateway_received_at`
at the gateway, `_odb_clickhouse_inserted_at` at INSERT time). Latency was the difference between these two values,
computed via a query on Clickhouse. Both components, the OTel exporter and the ClickHouse ingestor, are documented on the
[Integrations](/buffer/integrations) page.
 ### Cost
| S3 cost component | Measured rate | List price (us-east-1) | Monthly |
| ---------------------------------------------------------- | ------------- | ---------------------- | ----------- |
| PUT — batch uploads (7.1/s) + manifest CAS commits (5.3/s) | \~12.5/s | \$0.005 / 1k | \~\$162 |
| GET — consumer fetches + producer pre-CAS reads + polls | \~16/s | \$0.0004 / 1k | \~\$17 |
| Storage — batches GC'd promptly after ack | tens of GB | \$0.023 / GB-mo | \< \$5 |
| Network — in-region via S3 Gateway endpoint | — | \$0 | \$0 |
| **Total** | | | **\~\$180** |
## Reproduce it
* Setup for both components: [Buffer integrations](/buffer/integrations)
* Producer client and OTel exporter: [opendata-go](https://github.com/opendata-oss/opendata-go#producer-architecture)
* ClickHouse ingestor: [opendata-contrib](https://github.com/opendata-oss/opendata-contrib/tree/main/connectors/clickhouse-ingestor)
* 5-minute local OTel → ClickHouse pipeline: [tutorial](https://github.com/opendata-oss/opendata-contrib/tree/main/tutorial)
* Design: [stateless buffer RFC](https://github.com/opendata-oss/opendata/blob/main/buffer/rfcs/0001-stateless-buffer.md) and the [pipelined consumer RFC](https://github.com/opendata-oss/opendata-contrib/blob/main/rfcs/0002-generic-ingest-runtime.md)
### Cost
| S3 cost component | Measured rate | List price (us-east-1) | Monthly |
| ---------------------------------------------------------- | ------------- | ---------------------- | ----------- |
| PUT — batch uploads (7.1/s) + manifest CAS commits (5.3/s) | \~12.5/s | \$0.005 / 1k | \~\$162 |
| GET — consumer fetches + producer pre-CAS reads + polls | \~16/s | \$0.0004 / 1k | \~\$17 |
| Storage — batches GC'd promptly after ack | tens of GB | \$0.023 / GB-mo | \< \$5 |
| Network — in-region via S3 Gateway endpoint | — | \$0 | \$0 |
| **Total** | | | **\~\$180** |
## Reproduce it
* Setup for both components: [Buffer integrations](/buffer/integrations)
* Producer client and OTel exporter: [opendata-go](https://github.com/opendata-oss/opendata-go#producer-architecture)
* ClickHouse ingestor: [opendata-contrib](https://github.com/opendata-oss/opendata-contrib/tree/main/connectors/clickhouse-ingestor)
* 5-minute local OTel → ClickHouse pipeline: [tutorial](https://github.com/opendata-oss/opendata-contrib/tree/main/tutorial)
* Design: [stateless buffer RFC](https://github.com/opendata-oss/opendata/blob/main/buffer/rfcs/0001-stateless-buffer.md) and the [pipelined consumer RFC](https://github.com/opendata-oss/opendata-contrib/blob/main/rfcs/0002-generic-ingest-runtime.md)