> ## Documentation Index
> Fetch the complete documentation index at: https://opendata.dev/docs/llms.txt
> Use this file to discover all available pages before exploring further.
# Timeseries Benchmarks
> Ingestion throughput, query latency, and cost for a single-node Timeseries deployment
## Ingestion
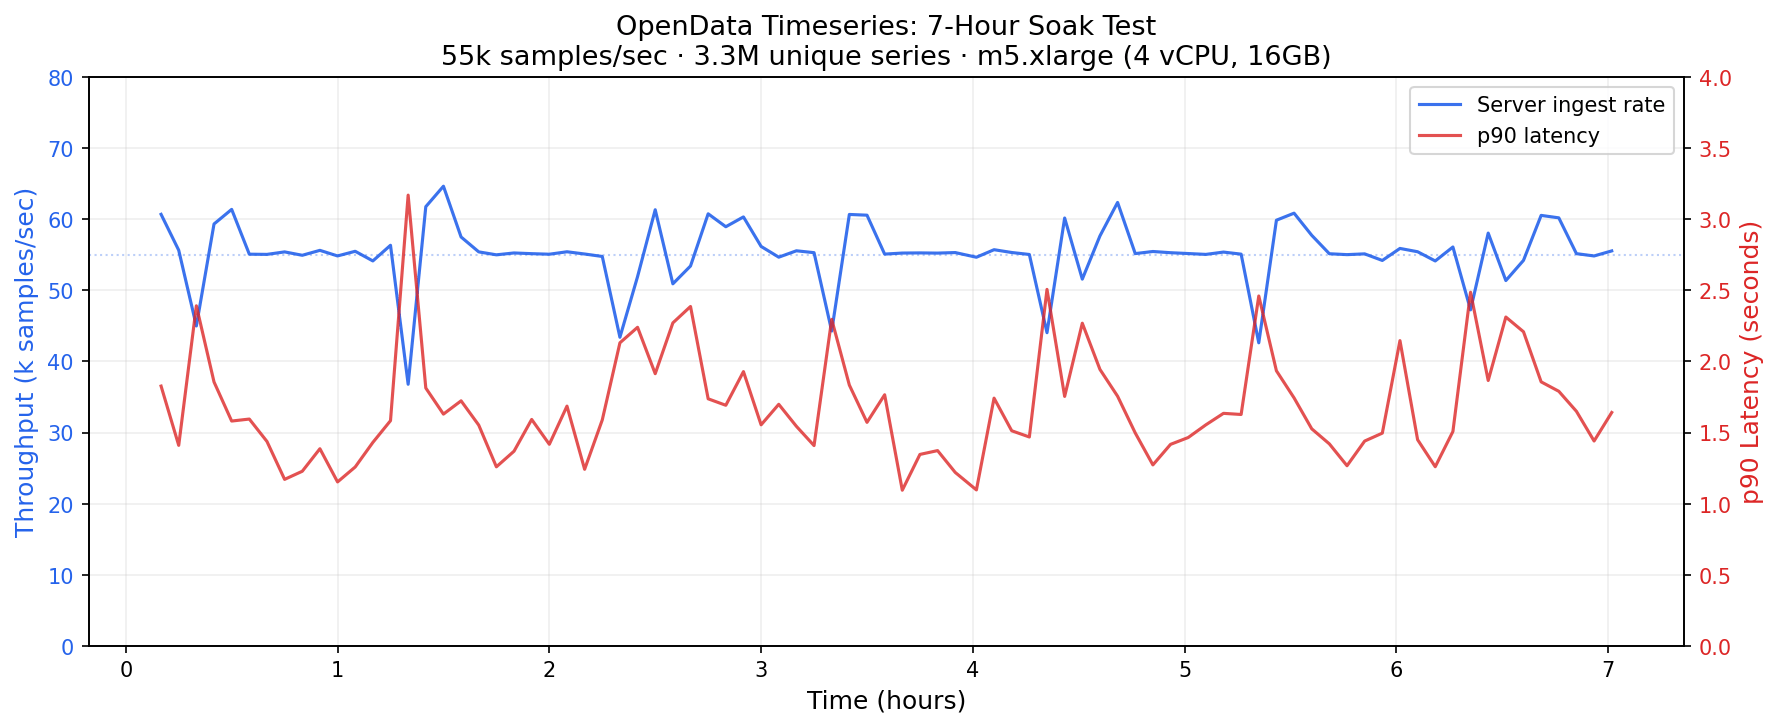
Ingestion was measured with [p8s-bench](https://github.com/responsivedev/p8s-bench),
a harness around VictoriaMetrics'
[prometheus-benchmark](https://github.com/VictoriaMetrics/prometheus-benchmark)
tool. The load generator produced samples for 5,100 targets every 60 seconds,
for a total of \~3.3M unique active series.
On a single `m5.xlarge` node (4 vCPU, 16 GB RAM) with SlateDB's WAL disabled,
Timeseries sustained:
| Metric | Result |
| ------------------- | --------------------------- |
| Sustained ingestion | **55k samples/sec** |
| Daily volume | **4.7B samples/day** |
| Active series | \~3.3M unique series |
| Node | `m5.xlarge` (4 vCPU, 16 GB) |
 Disabling the WAL is acceptable for many timeseries workloads, particularly
those paired with a durable upstream log like
[OpenData Buffer](/buffer).
## Query latency
Query latency depends mostly on how much data a query touches and whether that
data is already in the SlateDB block cache. The chart below plots cold and warm
query latency as a function of the number of series matched and scanned over a
6-hour time range.
Disabling the WAL is acceptable for many timeseries workloads, particularly
those paired with a durable upstream log like
[OpenData Buffer](/buffer).
## Query latency
Query latency depends mostly on how much data a query touches and whether that
data is already in the SlateDB block cache. The chart below plots cold and warm
query latency as a function of the number of series matched and scanned over a
6-hour time range.
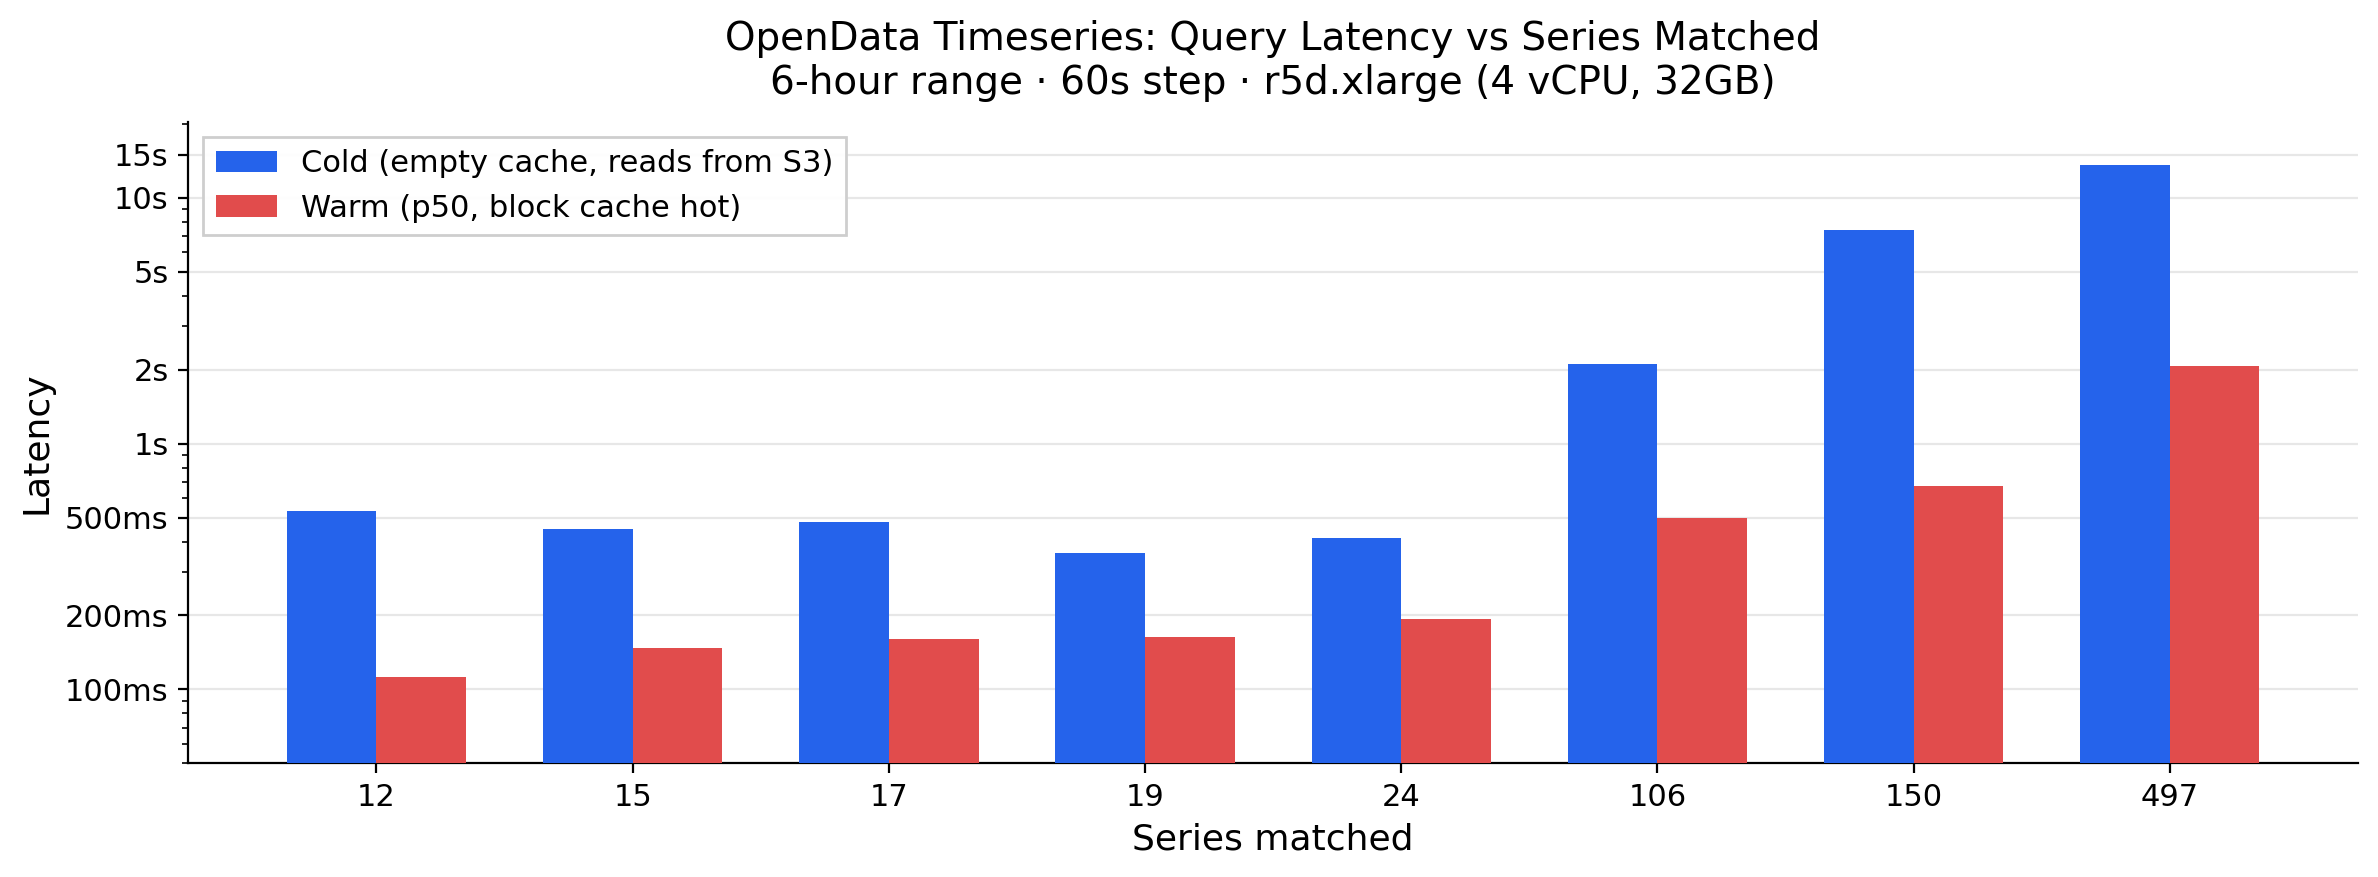 Warm numbers are the ones that matter for day-to-day use: alerts and active
dashboards keep their data warm, and once recent data is in the block cache,
queries stop paying object-store round trips. On the benchmark `r5d.xlarge`
node, roughly 8 GB of RAM plus \~140 GB of NVMe-backed disk cache keep several
weeks of data warm (assuming 1–2 bytes per sample for Gorilla-compressed
blocks).
Cold reads pay the object-store round trip (10–100 ms).
## Cost
The same workload (3.3M active series, 4.7B samples/day) costs roughly **\$560/month
of compute**:
| Component | Spec | Monthly |
| ----------------- | ----------------------------------- | ------------- |
| Writer | 1× `m5.xlarge` | \~\$140 |
| Readers | 2× `r5d.xlarge` (140 GB local NVMe) | \~\$210 each |
| **Compute total** | | **\~\$560** |
| S3 PUT requests | WAL disabled | \~\$5–12 |
| S3 storage | standard rates | a few dollars |
## Reproduce it
* Ingestion harness: [p8s-bench](https://github.com/responsivedev/p8s-bench)
* Underlying tool: [VictoriaMetrics prometheus-benchmark](https://github.com/VictoriaMetrics/prometheus-benchmark)
* Storage design: [Timeseries storage design](/timeseries/storage-design) and the [TSDB storage RFC](https://github.com/opendata-oss/opendata/blob/main/timeseries/rfcs/0001-tsdb-storage.md)
Warm numbers are the ones that matter for day-to-day use: alerts and active
dashboards keep their data warm, and once recent data is in the block cache,
queries stop paying object-store round trips. On the benchmark `r5d.xlarge`
node, roughly 8 GB of RAM plus \~140 GB of NVMe-backed disk cache keep several
weeks of data warm (assuming 1–2 bytes per sample for Gorilla-compressed
blocks).
Cold reads pay the object-store round trip (10–100 ms).
## Cost
The same workload (3.3M active series, 4.7B samples/day) costs roughly **\$560/month
of compute**:
| Component | Spec | Monthly |
| ----------------- | ----------------------------------- | ------------- |
| Writer | 1× `m5.xlarge` | \~\$140 |
| Readers | 2× `r5d.xlarge` (140 GB local NVMe) | \~\$210 each |
| **Compute total** | | **\~\$560** |
| S3 PUT requests | WAL disabled | \~\$5–12 |
| S3 storage | standard rates | a few dollars |
## Reproduce it
* Ingestion harness: [p8s-bench](https://github.com/responsivedev/p8s-bench)
* Underlying tool: [VictoriaMetrics prometheus-benchmark](https://github.com/VictoriaMetrics/prometheus-benchmark)
* Storage design: [Timeseries storage design](/timeseries/storage-design) and the [TSDB storage RFC](https://github.com/opendata-oss/opendata/blob/main/timeseries/rfcs/0001-tsdb-storage.md)