> ## Documentation Index
> Fetch the complete documentation index at: https://opendata.dev/docs/llms.txt
> Use this file to discover all available pages before exploring further.
# Timeseries Quickstart
> Install Timeseries locally and query metrics in minutes
Get a Prometheus-compatible metrics database running on your machine in under
five minutes. You will install Timeseries, configure it to scrape its own
metrics, query those metrics in the built-in UI, and then add an external target.
## Install OpenData Timeseries
Download and install the Timeseries binary:
```bash theme={null}
curl -fsSL https://www.opendata.dev/install.sh | sh -s -- timeseries
```
This places the `opendata-timeseries` binary in the current directory.
## Configure Timeseries
Create a file called `prometheus.yaml` with the following contents:
```yaml prometheus.yaml theme={null}
global:
scrape_interval: 15s
evaluation_interval: 15s
scrape_configs:
- job_name: "timeseries-server"
scrape_interval: 5s
scrape_timeout: 4s
metrics_path: /metrics
scheme: http
static_configs:
- targets: ["localhost:9090"]
storage:
type: SlateDb
path: data
object_store:
type: Local
path: ./data
flush_interval_secs: 30
```
This configuration has three sections:
* **global** sets the default scrape and evaluation intervals for all jobs.
* **scrape\_configs** tells Timeseries what to scrape. For now, it scrapes itself
at `localhost:9090` every 5 seconds.
* **storage** configures local [SlateDB](https://slatedb.io) as the storage
backend. Metrics are flushed to disk every 30 seconds under `./data`.
## Start the server
Run the binary with the configuration file you just created:
```bash theme={null}
./opendata-timeseries --config prometheus.yaml --port 9090
```
Timeseries starts, begins scraping its own `/metrics` endpoint, and stores
the results locally.
## Query metrics in the UI
Open [http://localhost:9090](http://localhost:9090) in your browser. Timeseries
ships with a built-in query UI where you can run PromQL expressions and
visualize results as tables or graphs.
### Check that the target is up
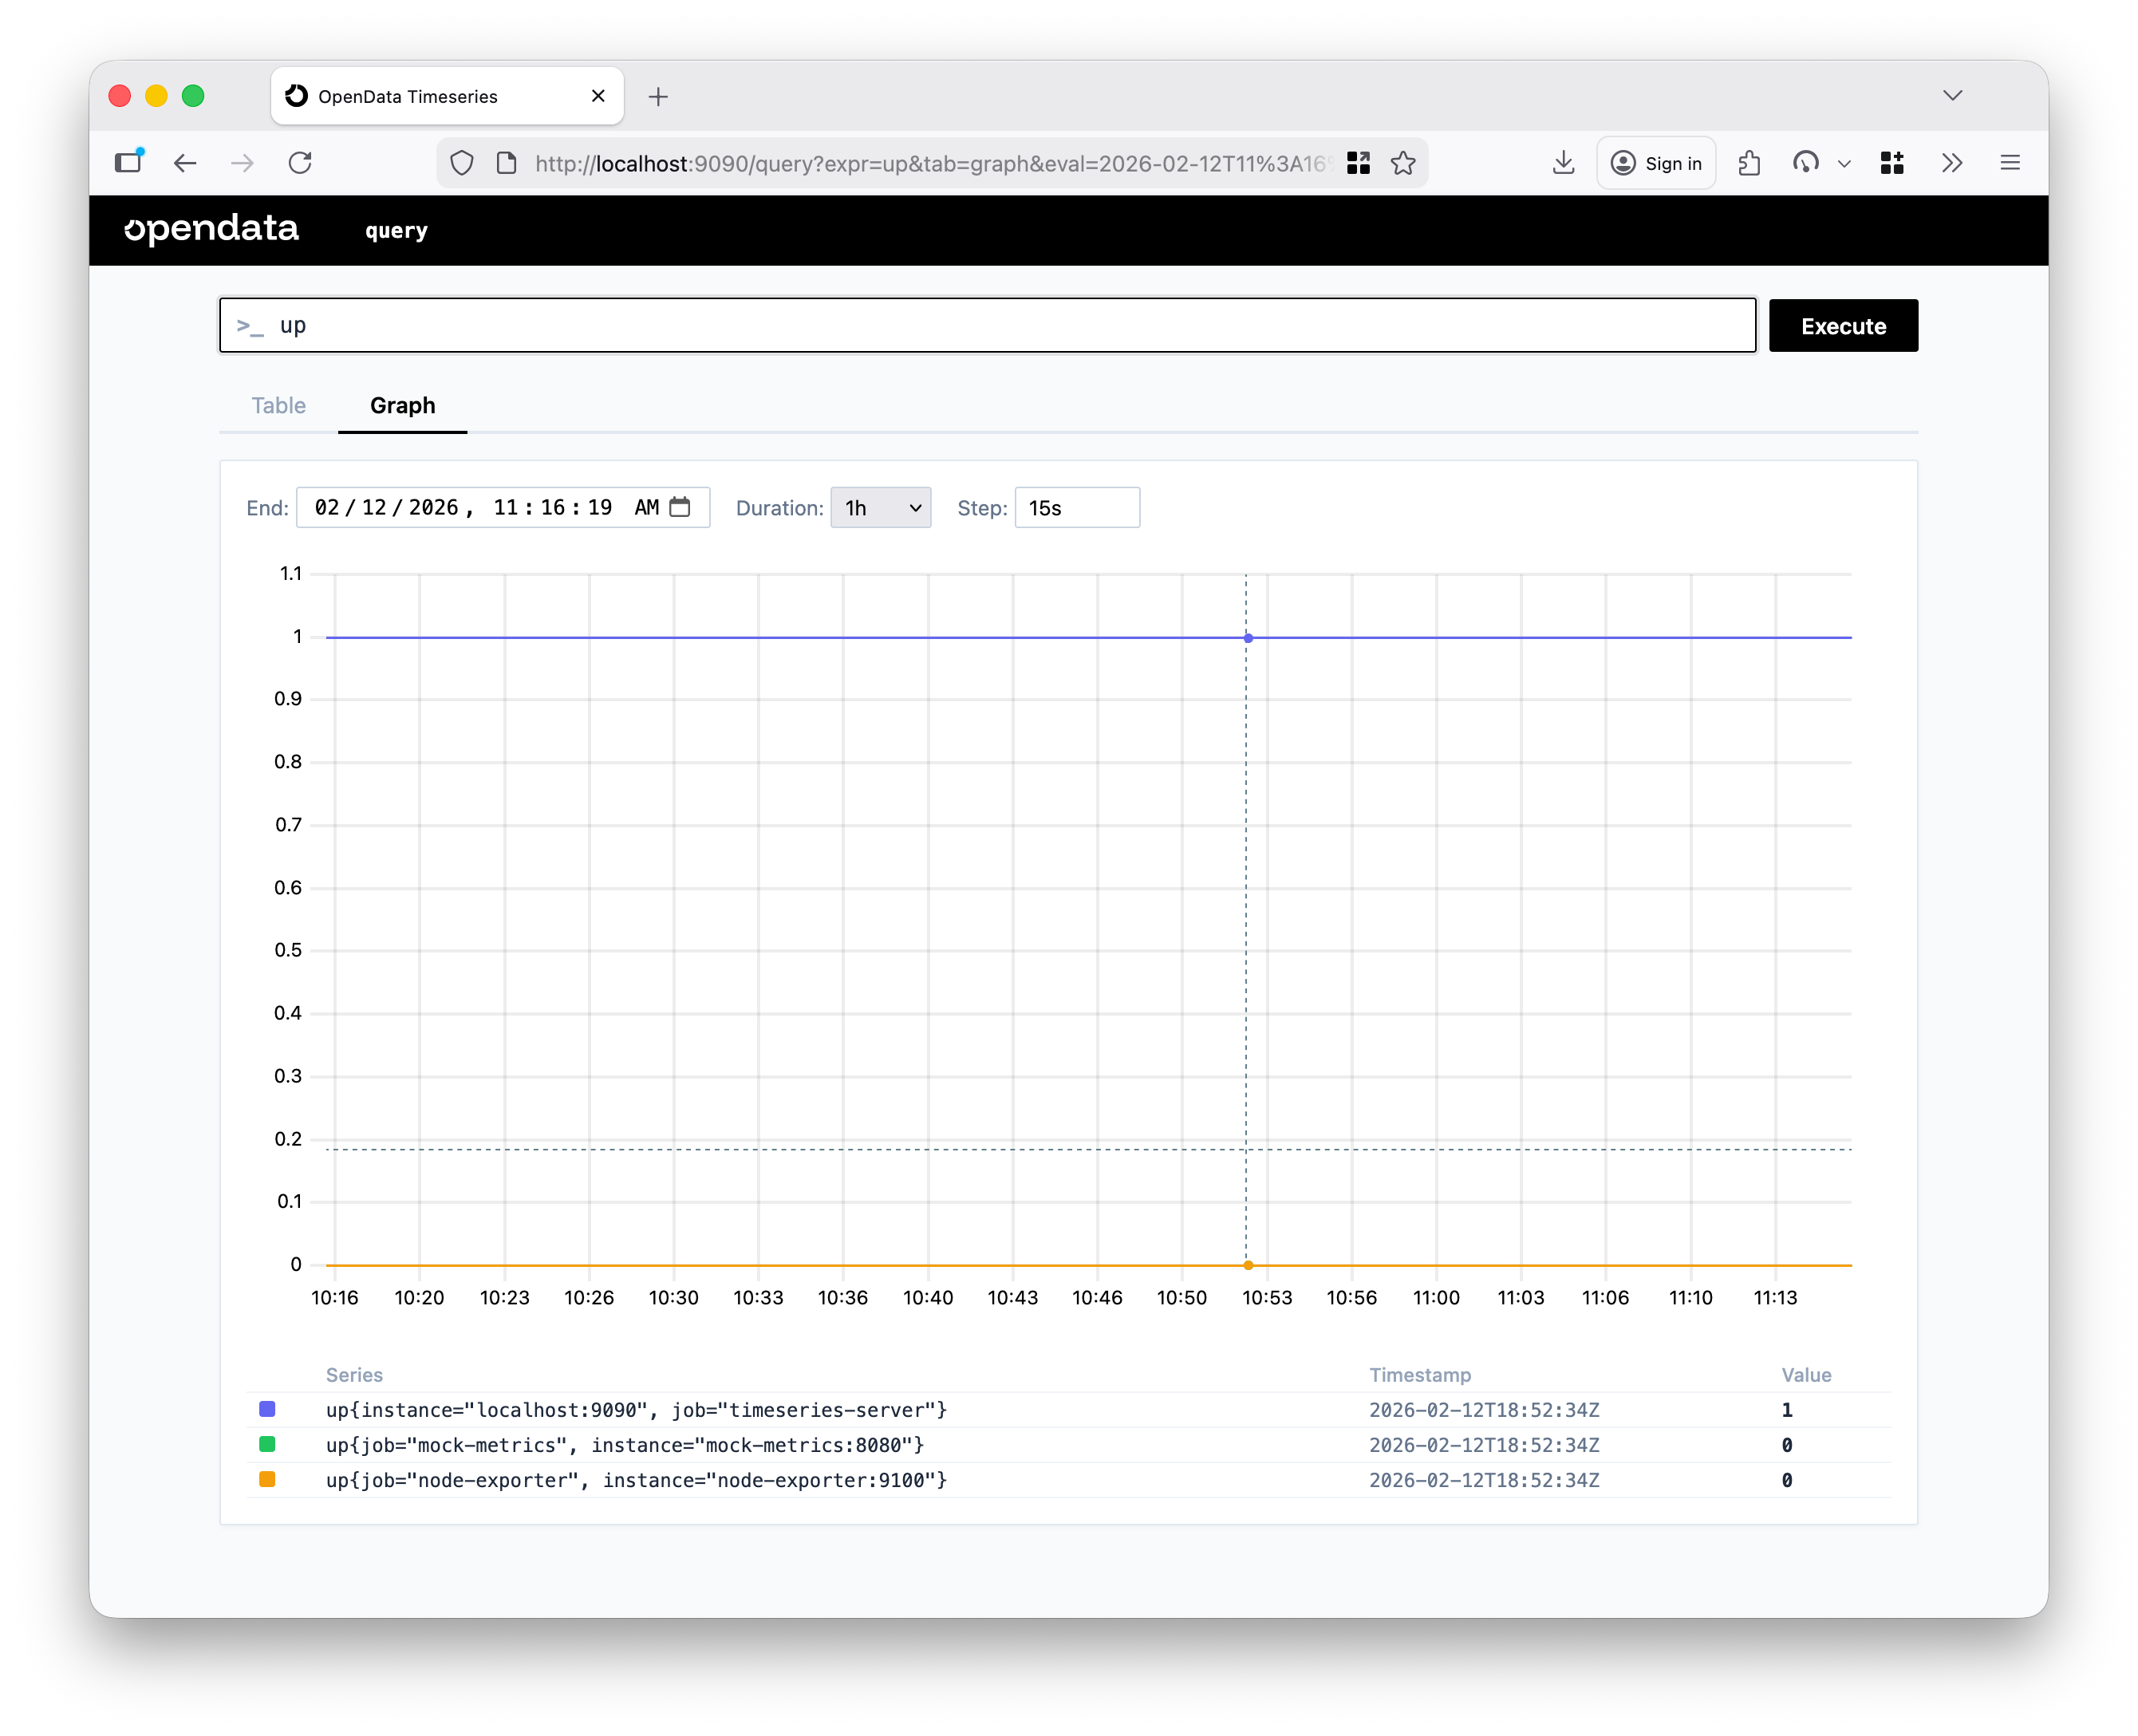
Type `up` into the expression bar and click **Execute**. Switch to the **Graph**
tab to see the result over time. A steady line at `1` means the target is
healthy and being scraped successfully.
 ### Explore more metrics
Try these expressions in the query bar to explore the metrics Timeseries
collects about itself:
* `http_requests` — total HTTP requests broken down by method, endpoint, and status
* `http_request_duration_seconds` — request latency histogram by endpoint
* `scrape_samples_scraped` — how many samples were collected per scrape
Use the **Table** tab for instant values or the **Graph** tab to see how
metrics change over time. The **Duration** and **Step** controls above the
graph let you adjust the time window and resolution.
## Scrape a target — Node Exporter
Scraping its own metrics is useful for verification, but the real value comes
from scraping external targets. [Node Exporter](https://prometheus.io/docs/guides/node-exporter/)
exposes hardware and OS metrics and is a good first target.
### Download and run Node Exporter
Download the latest release for your platform from the
[Prometheus downloads page](https://prometheus.io/download/#node_exporter),
extract it, and start it:
```bash theme={null}
tar xvfz node_exporter-*.tar.gz && rm node_exporter-*.tar.gz
cd node_exporter-*
# on macOS you might need the next line to avoid macOS blocking the execution of the binary
xattr -d com.apple.quarantine ./node_exporter
./node_exporter
```
Verify that metrics are being exposed:
```bash theme={null}
curl localhost:9100/metrics
```
You should see a large set of metrics prefixed with `node_`.
### Add Node Exporter as a scrape target
Update `prometheus.yaml` to include a new job under `scrape_configs`:
```yaml prometheus.yaml theme={null}
scrape_configs:
- job_name: "timeseries-server"
scrape_interval: 5s
scrape_timeout: 4s
metrics_path: /metrics
scheme: http
static_configs:
- targets: ["localhost:9090"]
- job_name: "node-exporter"
static_configs:
- targets: ["localhost:9100"]
```
Restart the Timeseries server to pick up the new configuration:
```bash theme={null}
./opendata-timeseries --config prometheus.yaml --port 9090
```
### Query Node Exporter metrics
After a few scrape intervals, head back to [http://localhost:9090](http://localhost:9090)
and try these expressions:
* `node_memory_free_bytes` — free system memory in bytes
* `node_memory_total_bytes` — total system memory in bytes
* `up` — now returns two results, one for each scrape target
* `sum(up)` — total number of healthy targets
## Next steps
* Learn about all available settings in [Configuration](/timeseries/configuration).
* Explore the full query and write API in the API Reference section in the sidebar.
* Connect [Grafana](https://grafana.com) as a visualization layer — Timeseries
is compatible with the Prometheus data source out of the box.
### Explore more metrics
Try these expressions in the query bar to explore the metrics Timeseries
collects about itself:
* `http_requests` — total HTTP requests broken down by method, endpoint, and status
* `http_request_duration_seconds` — request latency histogram by endpoint
* `scrape_samples_scraped` — how many samples were collected per scrape
Use the **Table** tab for instant values or the **Graph** tab to see how
metrics change over time. The **Duration** and **Step** controls above the
graph let you adjust the time window and resolution.
## Scrape a target — Node Exporter
Scraping its own metrics is useful for verification, but the real value comes
from scraping external targets. [Node Exporter](https://prometheus.io/docs/guides/node-exporter/)
exposes hardware and OS metrics and is a good first target.
### Download and run Node Exporter
Download the latest release for your platform from the
[Prometheus downloads page](https://prometheus.io/download/#node_exporter),
extract it, and start it:
```bash theme={null}
tar xvfz node_exporter-*.tar.gz && rm node_exporter-*.tar.gz
cd node_exporter-*
# on macOS you might need the next line to avoid macOS blocking the execution of the binary
xattr -d com.apple.quarantine ./node_exporter
./node_exporter
```
Verify that metrics are being exposed:
```bash theme={null}
curl localhost:9100/metrics
```
You should see a large set of metrics prefixed with `node_`.
### Add Node Exporter as a scrape target
Update `prometheus.yaml` to include a new job under `scrape_configs`:
```yaml prometheus.yaml theme={null}
scrape_configs:
- job_name: "timeseries-server"
scrape_interval: 5s
scrape_timeout: 4s
metrics_path: /metrics
scheme: http
static_configs:
- targets: ["localhost:9090"]
- job_name: "node-exporter"
static_configs:
- targets: ["localhost:9100"]
```
Restart the Timeseries server to pick up the new configuration:
```bash theme={null}
./opendata-timeseries --config prometheus.yaml --port 9090
```
### Query Node Exporter metrics
After a few scrape intervals, head back to [http://localhost:9090](http://localhost:9090)
and try these expressions:
* `node_memory_free_bytes` — free system memory in bytes
* `node_memory_total_bytes` — total system memory in bytes
* `up` — now returns two results, one for each scrape target
* `sum(up)` — total number of healthy targets
## Next steps
* Learn about all available settings in [Configuration](/timeseries/configuration).
* Explore the full query and write API in the API Reference section in the sidebar.
* Connect [Grafana](https://grafana.com) as a visualization layer — Timeseries
is compatible with the Prometheus data source out of the box.