> ## Documentation Index
> Fetch the complete documentation index at: https://opendata.dev/docs/llms.txt
> Use this file to discover all available pages before exploring further.
# Vector Benchmarks
> Query latency, ingest throughput, and cost for OpenData Vector across standard ANN datasets
These are the benchmark results for OpenData Vector were measured on a
single `c6id.4xlarge` node against standard Approximate Nearest Neighbor (ANN)
datasets. You can reproduce them, or run the same measurements against your own data, with
[Vector Bench](#run-it-on-your-own-data).
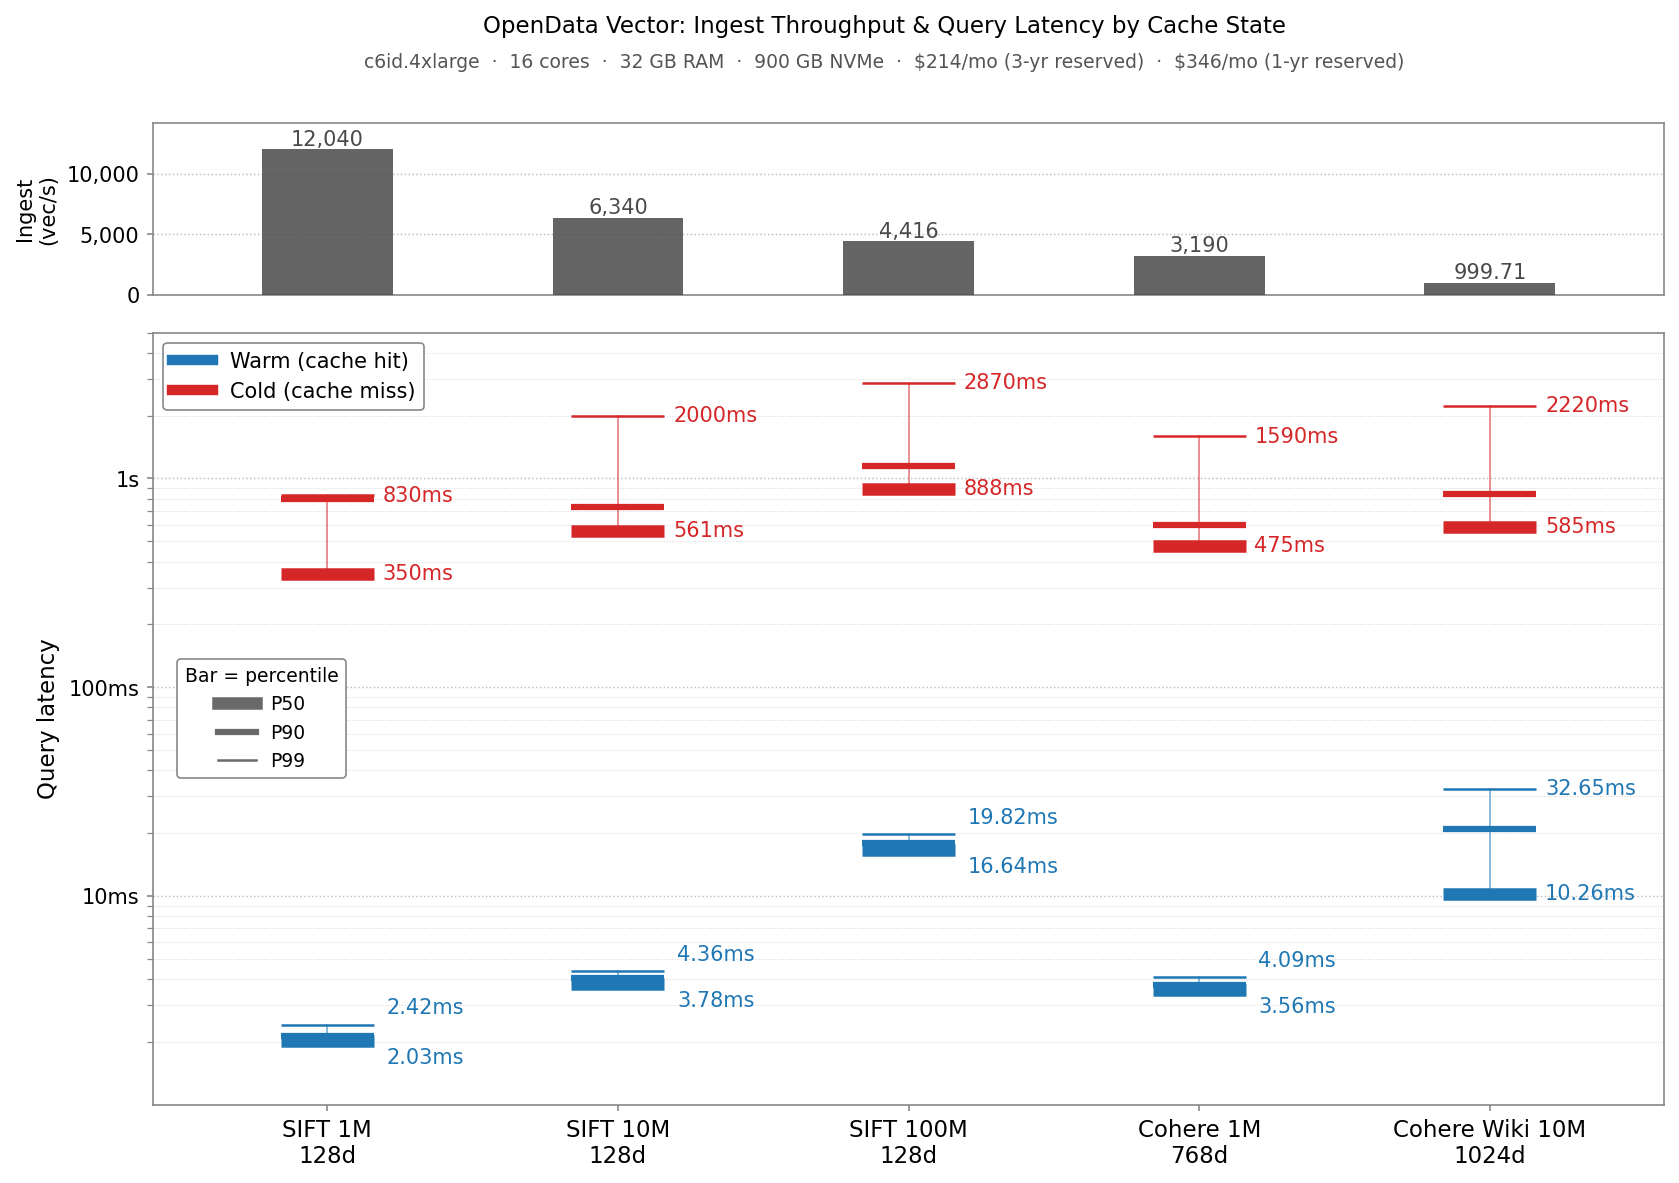
All latencies were recorded at a steady-state query throughput of **32 queries/s
at 90% recall** (SIFT 1M was recorded at 97% recall). Reported ingestion
throughput is the steady-state throughput for each dataset in isolation.
## Query latency
Here is the query latencies for different standard vector data sets, split by cold and warm latency.
 | Dataset class | Warm latency | Cold latency (P90) |
| --------------------------------- | ------------------- | ------------------ |
| Small (Sift1M, Sift10M, Cohere1M) | low single-digit ms | ≤ \~1 s |
| Large | low teens of ms | ≤ \~1 s |
For cold queries, tail latency is dominated by the slowest time to fetch a
posting list from S3. For warm queries against small datasets, all postings sit
in the in-memory cache, so latency reflects how fast Vector loads postings and
scores candidates. Larger datasets score more postings to reach high recall, and
some of those reads come from local disk cache, which adds delay.
## Ingest throughput
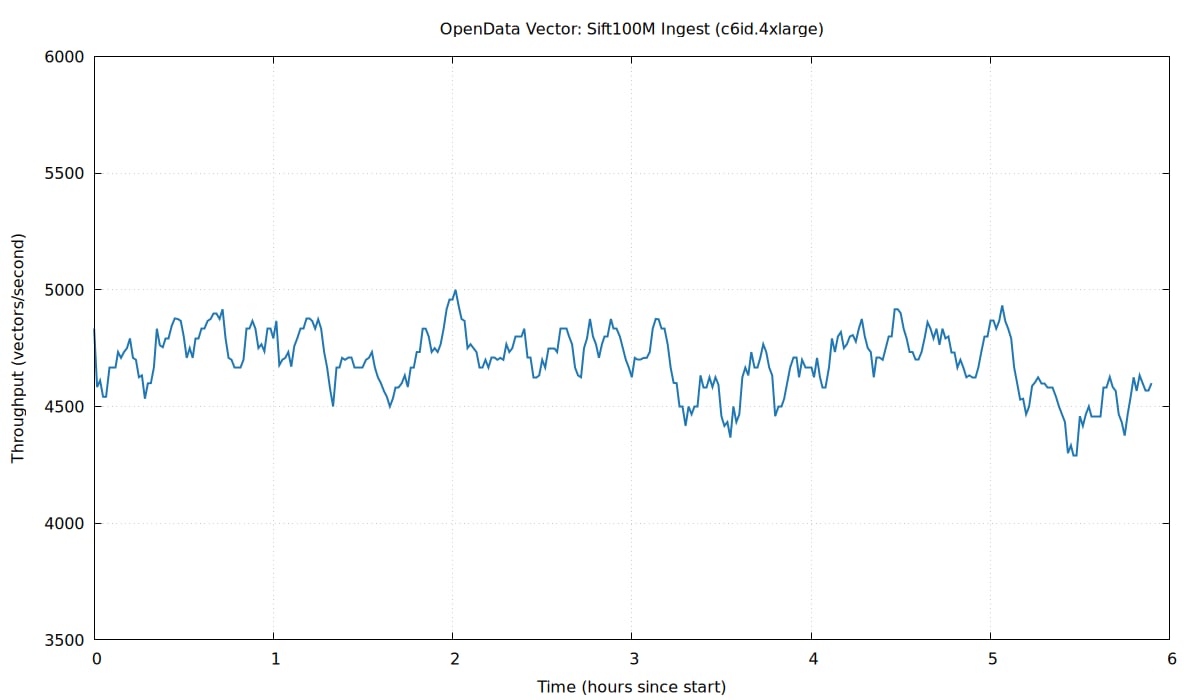
Vector sustains between **\~1K and \~12K vector writes/second**, depending on
dataset size and vector dimensions. Re-ingesting the full SIFT 100M dataset took
\~6 hours at a stable rate without significant stalls, demonstrating that the
LIRE compaction protocol ingests incrementally.
| Dataset class | Warm latency | Cold latency (P90) |
| --------------------------------- | ------------------- | ------------------ |
| Small (Sift1M, Sift10M, Cohere1M) | low single-digit ms | ≤ \~1 s |
| Large | low teens of ms | ≤ \~1 s |
For cold queries, tail latency is dominated by the slowest time to fetch a
posting list from S3. For warm queries against small datasets, all postings sit
in the in-memory cache, so latency reflects how fast Vector loads postings and
scores candidates. Larger datasets score more postings to reach high recall, and
some of those reads come from local disk cache, which adds delay.
## Ingest throughput
Vector sustains between **\~1K and \~12K vector writes/second**, depending on
dataset size and vector dimensions. Re-ingesting the full SIFT 100M dataset took
\~6 hours at a stable rate without significant stalls, demonstrating that the
LIRE compaction protocol ingests incrementally.
 Ingestion is bottlenecked on (1) traversing the centroid index to assign vectors
to postings and (2) computing new clusters when centroids split during LIRE.
More vectors means more centroids to search while more dimensions makes distance
computation more expensive.
## Cost
Vector serves 100M vectors for roughly **\$346/month of compute** (1×
`c6id.4xlarge` on a 1-year reservation):
| Component | Driver | Monthly |
| --------------- | ----------------------------------------------------------------- | --------------- |
| Compute | 1× `c6id.4xlarge` (1-yr reservation) | \$346 |
| S3 PUT requests | \~1 SlateDB write/sec | tens of dollars |
| S3 storage | SIFT 100M ≈ 200–500 GB after attributes + LSM space amplification | \~\$5–12 |
S3 charges sit outside the compute figure but stay small: Vector batches writes
into roughly one SlateDB write per second.
## Run it on your own data
The benchmark harness is open source:
[`vector/bench/`](https://github.com/opendata-oss/opendata/tree/main/vector/bench)
in the OpenData repository.
Vector Bench runs each dataset through three independent phases, since Vector's
design fully decouples read and write workloads so you can capacity-plan them
separately:
| Phase | What it measures |
| -------- | --------------------------------------------------------------------------------------------------------------------- |
| `INGEST` | ingestion throughput as a 5-minute trailing window (sampled every minute) |
| `WARM` | recall\@10, QPS, and p50/p90/p99 latency after a warmup pass, under a rate-limited concurrent query workload |
| `COLD` | query performance with a freshly-allocated memory-only block cache, so every SST block read comes from object storage |
### Included datasets
| Dataset | Vectors | Dimensions | Source |
| ----------------------------------------- | ---------- | ---------- | ------------------------- |
| SIFT/BIGANN (100K, 1M, 10M, 100M subsets) | up to 100M | 128 | image feature embeddings |
| Cohere1M | 1M | 768 | Wikipedia text embeddings |
| Cohere10M | 10M | 1024 | Wikipedia text embeddings |
You can also point the benchmark at your own data in `fvecs`, `bvecs`, or
parquet format. The simplest way to start is the 100K-vector SIFT subset that
ships in the repo:
```bash theme={null}
cargo run -p vector-bench --release -- --config vector/bench/sift100k.toml
```
That exercises all three phases against a SlateDB pointed at a local object
store and takes \~20 seconds on a laptop. See the
[README](https://github.com/opendata-oss/opendata/blob/main/vector/bench/README.md)
for configuring larger runs against a real object store, and for the bundled
Claude Skill that infers a config from your raw data.
Ingestion is bottlenecked on (1) traversing the centroid index to assign vectors
to postings and (2) computing new clusters when centroids split during LIRE.
More vectors means more centroids to search while more dimensions makes distance
computation more expensive.
## Cost
Vector serves 100M vectors for roughly **\$346/month of compute** (1×
`c6id.4xlarge` on a 1-year reservation):
| Component | Driver | Monthly |
| --------------- | ----------------------------------------------------------------- | --------------- |
| Compute | 1× `c6id.4xlarge` (1-yr reservation) | \$346 |
| S3 PUT requests | \~1 SlateDB write/sec | tens of dollars |
| S3 storage | SIFT 100M ≈ 200–500 GB after attributes + LSM space amplification | \~\$5–12 |
S3 charges sit outside the compute figure but stay small: Vector batches writes
into roughly one SlateDB write per second.
## Run it on your own data
The benchmark harness is open source:
[`vector/bench/`](https://github.com/opendata-oss/opendata/tree/main/vector/bench)
in the OpenData repository.
Vector Bench runs each dataset through three independent phases, since Vector's
design fully decouples read and write workloads so you can capacity-plan them
separately:
| Phase | What it measures |
| -------- | --------------------------------------------------------------------------------------------------------------------- |
| `INGEST` | ingestion throughput as a 5-minute trailing window (sampled every minute) |
| `WARM` | recall\@10, QPS, and p50/p90/p99 latency after a warmup pass, under a rate-limited concurrent query workload |
| `COLD` | query performance with a freshly-allocated memory-only block cache, so every SST block read comes from object storage |
### Included datasets
| Dataset | Vectors | Dimensions | Source |
| ----------------------------------------- | ---------- | ---------- | ------------------------- |
| SIFT/BIGANN (100K, 1M, 10M, 100M subsets) | up to 100M | 128 | image feature embeddings |
| Cohere1M | 1M | 768 | Wikipedia text embeddings |
| Cohere10M | 10M | 1024 | Wikipedia text embeddings |
You can also point the benchmark at your own data in `fvecs`, `bvecs`, or
parquet format. The simplest way to start is the 100K-vector SIFT subset that
ships in the repo:
```bash theme={null}
cargo run -p vector-bench --release -- --config vector/bench/sift100k.toml
```
That exercises all three phases against a SlateDB pointed at a local object
store and takes \~20 seconds on a laptop. See the
[README](https://github.com/opendata-oss/opendata/blob/main/vector/bench/README.md)
for configuring larger runs against a real object store, and for the bundled
Claude Skill that infers a config from your raw data.