Install OpenData Timeseries
Download and install the Timeseries binary:opendata-timeseries binary in the current directory.
Configure Timeseries
Create a file calledprometheus.yaml with the following contents:
prometheus.yaml
- global sets the default scrape and evaluation intervals for all jobs.
- scrape_configs tells Timeseries what to scrape. For now, it scrapes itself
at
localhost:9090every 5 seconds. - storage configures local SlateDB as the storage
backend. Metrics are flushed to disk every 30 seconds under
./data.
Start the server
Run the binary with the configuration file you just created:/metrics endpoint, and stores
the results locally.
Query metrics in the UI
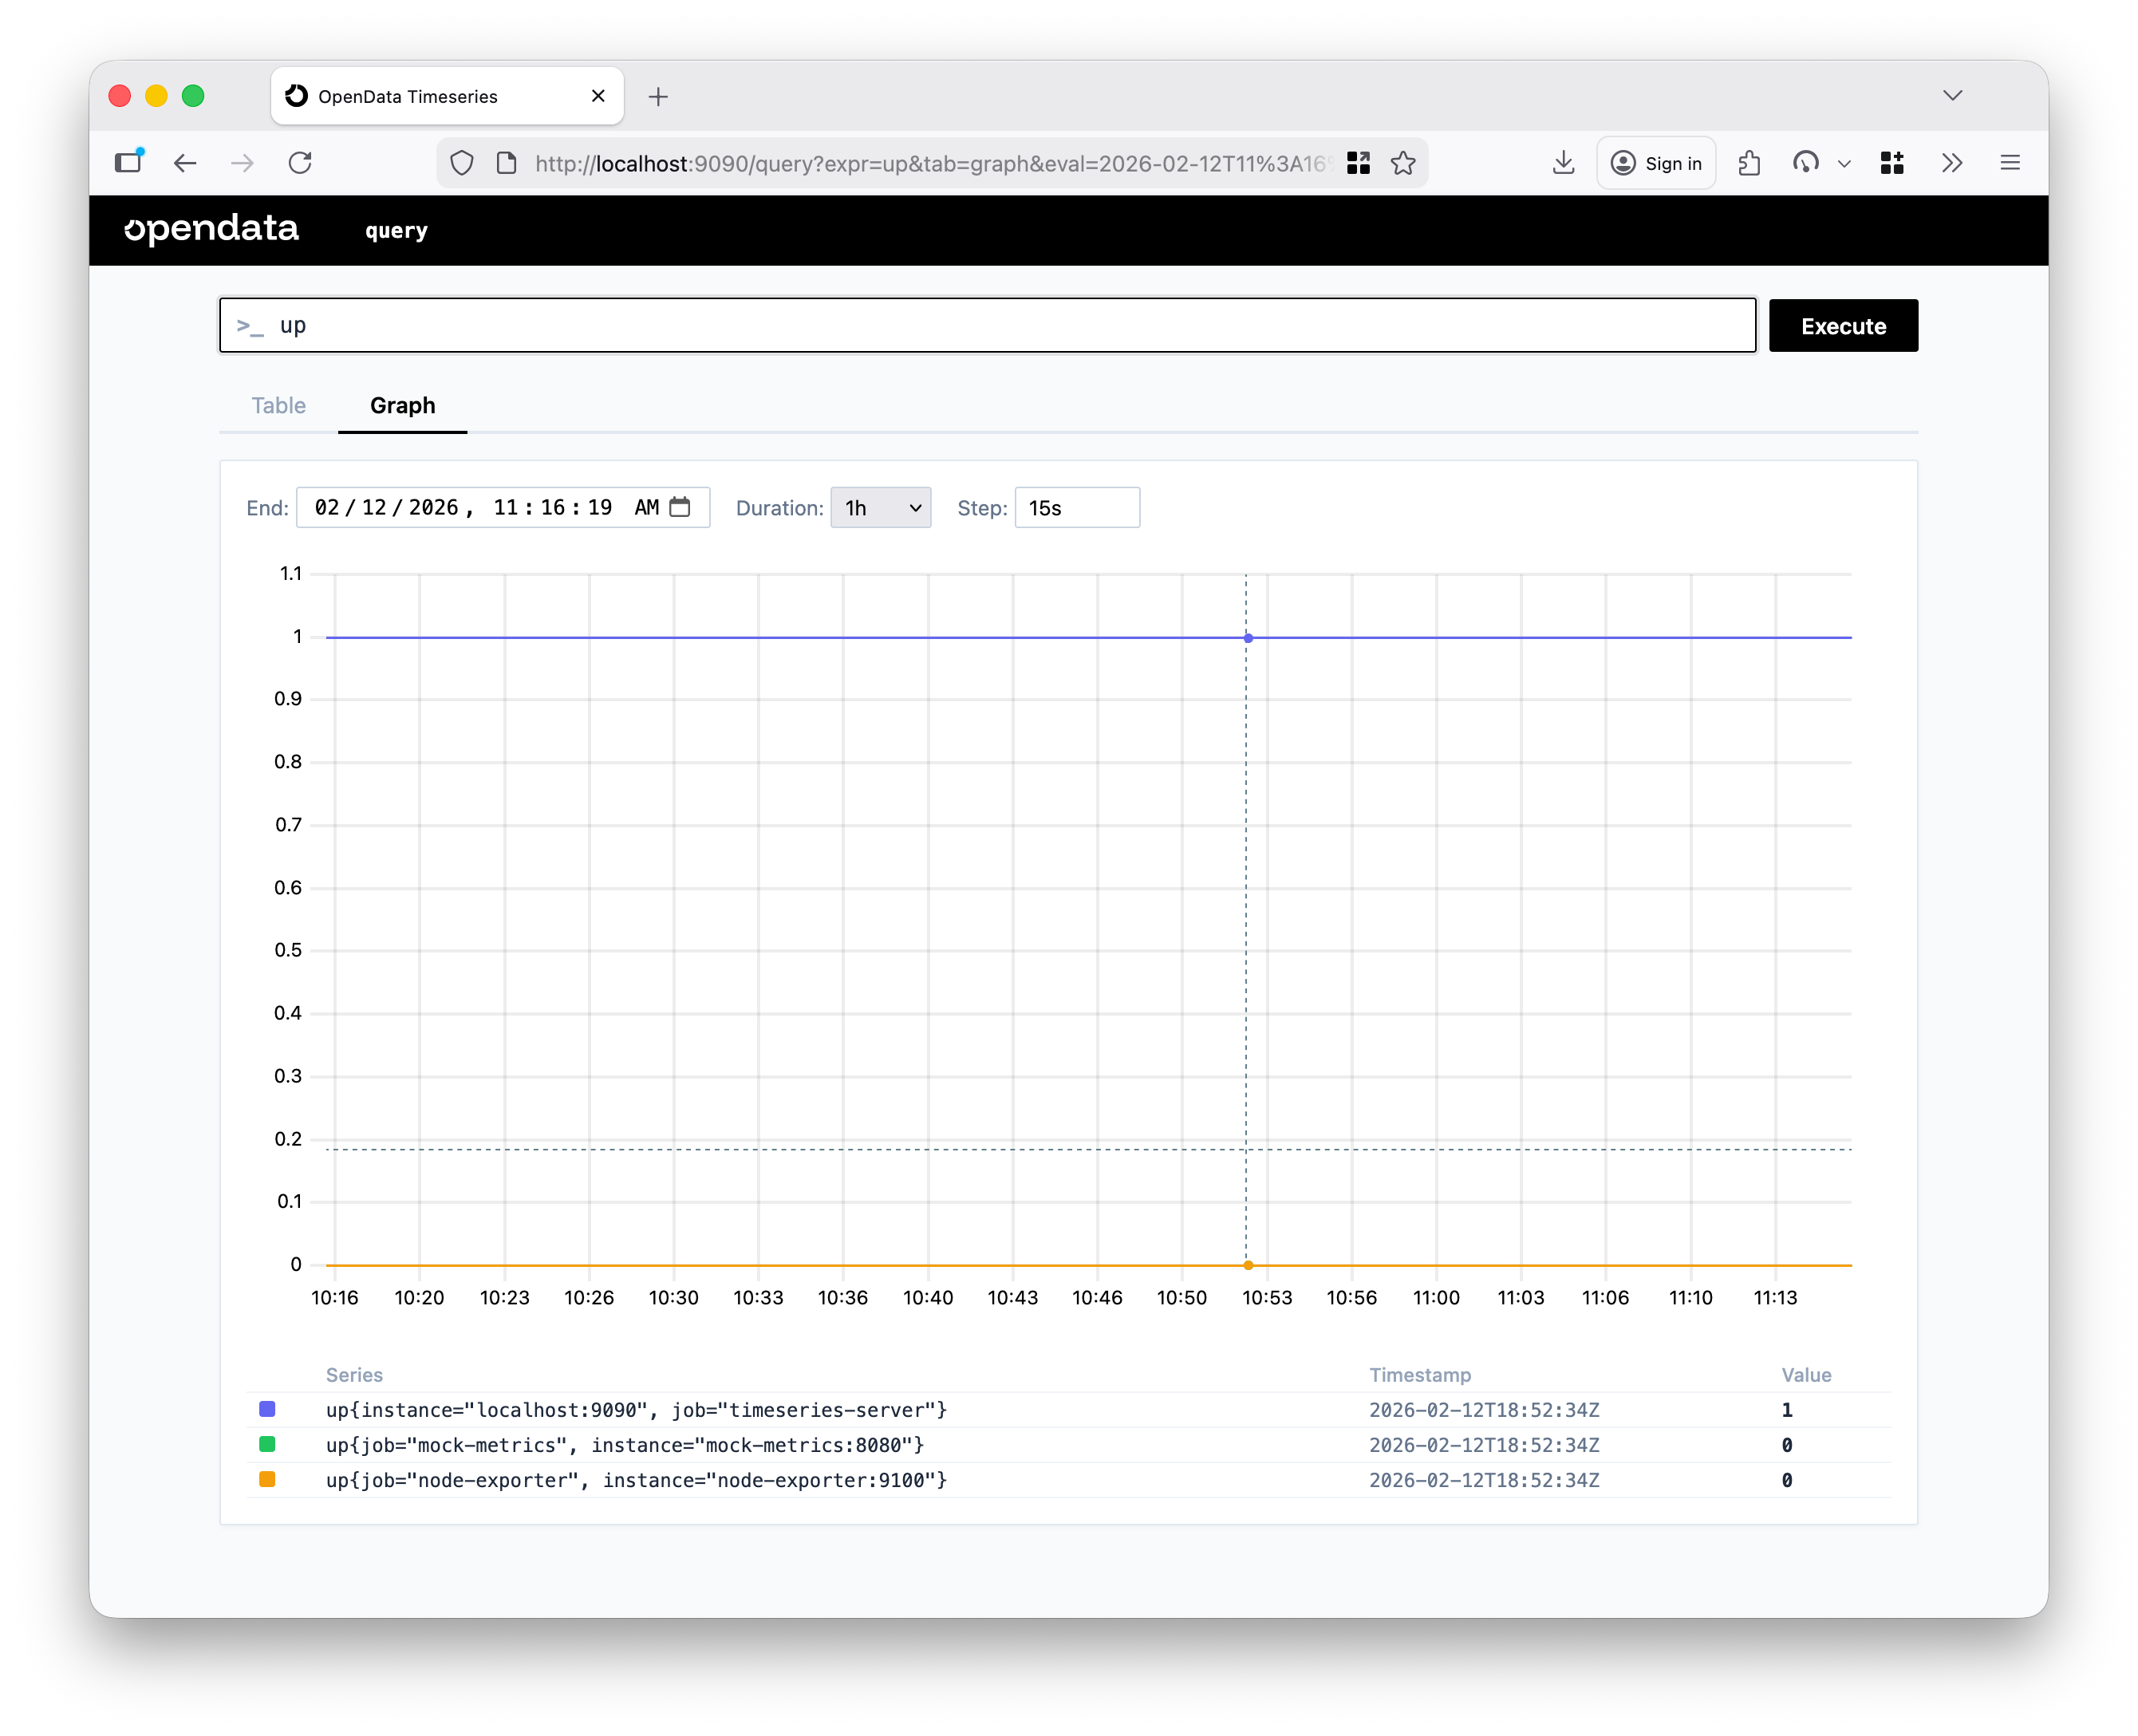
Open http://localhost:9090 in your browser. Timeseries ships with a built-in query UI where you can run PromQL expressions and visualize results as tables or graphs.Check that the target is up
Typeup into the expression bar and click Execute. Switch to the Graph
tab to see the result over time. A steady line at 1 means the target is
healthy and being scraped successfully.
Explore more metrics
Try these expressions in the query bar to explore the metrics Timeseries collects about itself:http_requests— total HTTP requests broken down by method, endpoint, and statushttp_request_duration_seconds— request latency histogram by endpointscrape_samples_scraped— how many samples were collected per scrape
Scrape a target — Node Exporter
Scraping its own metrics is useful for verification, but the real value comes from scraping external targets. Node Exporter exposes hardware and OS metrics and is a good first target.Download and run Node Exporter
Download the latest release for your platform from the Prometheus downloads page, extract it, and start it:node_.
Add Node Exporter as a scrape target
Updateprometheus.yaml to include a new job under scrape_configs:
prometheus.yaml
Query Node Exporter metrics
After a few scrape intervals, head back to http://localhost:9090 and try these expressions:node_memory_free_bytes— free system memory in bytesnode_memory_total_bytes— total system memory in bytesup— now returns two results, one for each scrape targetsum(up)— total number of healthy targets
Next steps
- Learn about all available settings in Configuration.
- Explore the full query and write API in the API Reference section in the sidebar.
- Connect Grafana as a visualization layer — Timeseries is compatible with the Prometheus data source out of the box.