

Writing Metrics to OpenData Timeseries
We ran an 8-hour experiment running three Buffer producers, each producing 10 MB/s (30 MB/s total), with flush and poll intervals of 100 ms. Latency is measured from the producer receiving a data entry to the Buffer consumer reading it.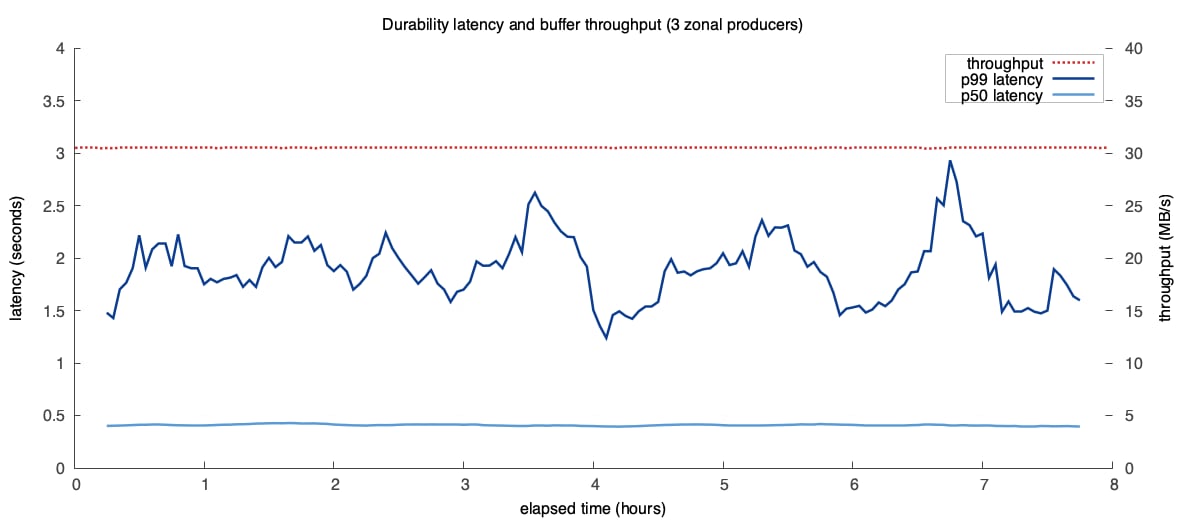
End-to-end latency and throughput over the 8-hour, 30 MB/s benchmark.
Cost
S3 costs over the experiment, projected to a monthly bill:OTel → ClickHouse pipeline
This benchmark used the pipelined producer and consumer runtimes to measure the maximum throughput of writing Logs from an Otel Collector to Clickhouse. A single loadgen drove 175,000 log records/sec into one OTel gateway pod over OTLP/gRPC. The gateway ran the OpenData producer, which appended OTel payloads to Buffer on S3. A separate node running the ClickHouse ingestor consumed the payloads and inserted them into ClickHouse. End-to-end latency was measured from two timestamps stamped onto each record (_odb_gateway_received_at
at the gateway, _odb_clickhouse_inserted_at at INSERT time). Latency was the difference between these two values,
computed via a query on Clickhouse. Both components, the OTel exporter and the ClickHouse ingestor, are documented on the
Integrations page.
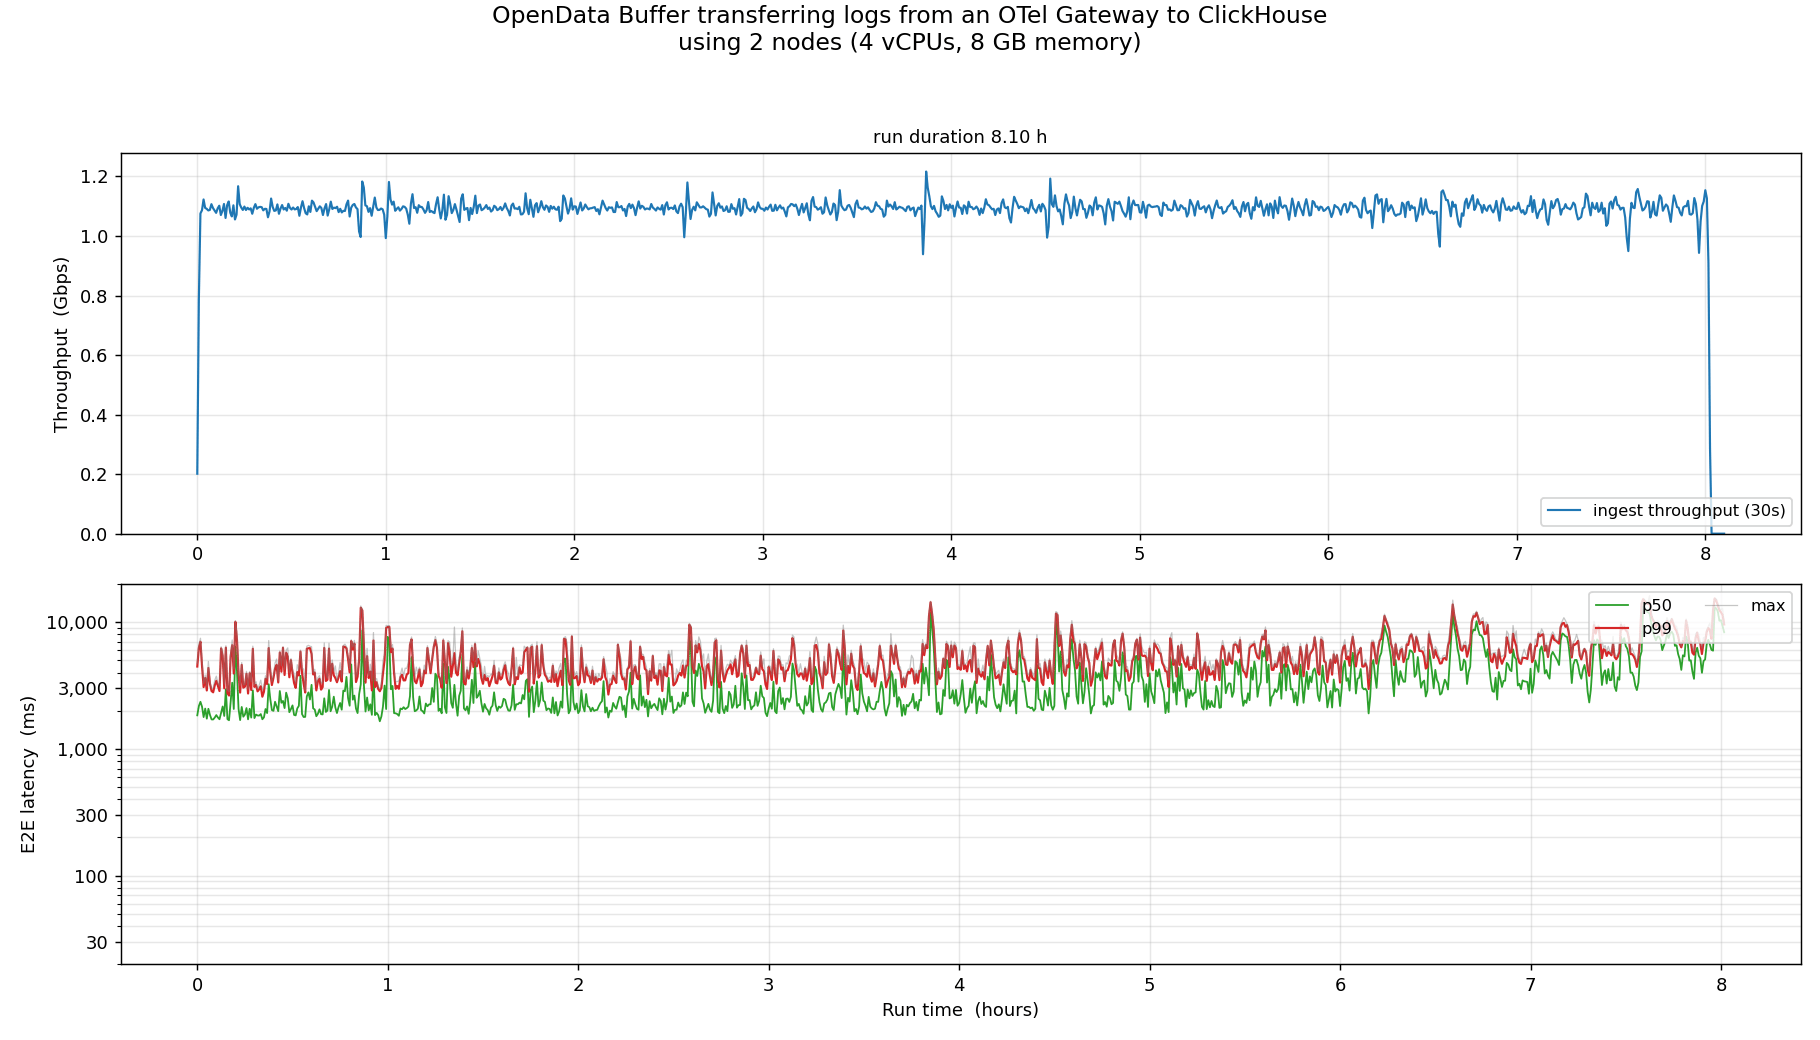
Throughput and end-to-end latency over the 1.1 Gbps OTel → ClickHouse run.
Cost
Reproduce it
- Setup for both components: Buffer integrations
- Producer client and OTel exporter: opendata-go
- ClickHouse ingestor: opendata-contrib
- 5-minute local OTel → ClickHouse pipeline: tutorial
- Design: stateless buffer RFC and the pipelined consumer RFC